

 Image: A visual representation of the correlation between housing prices and inflation.
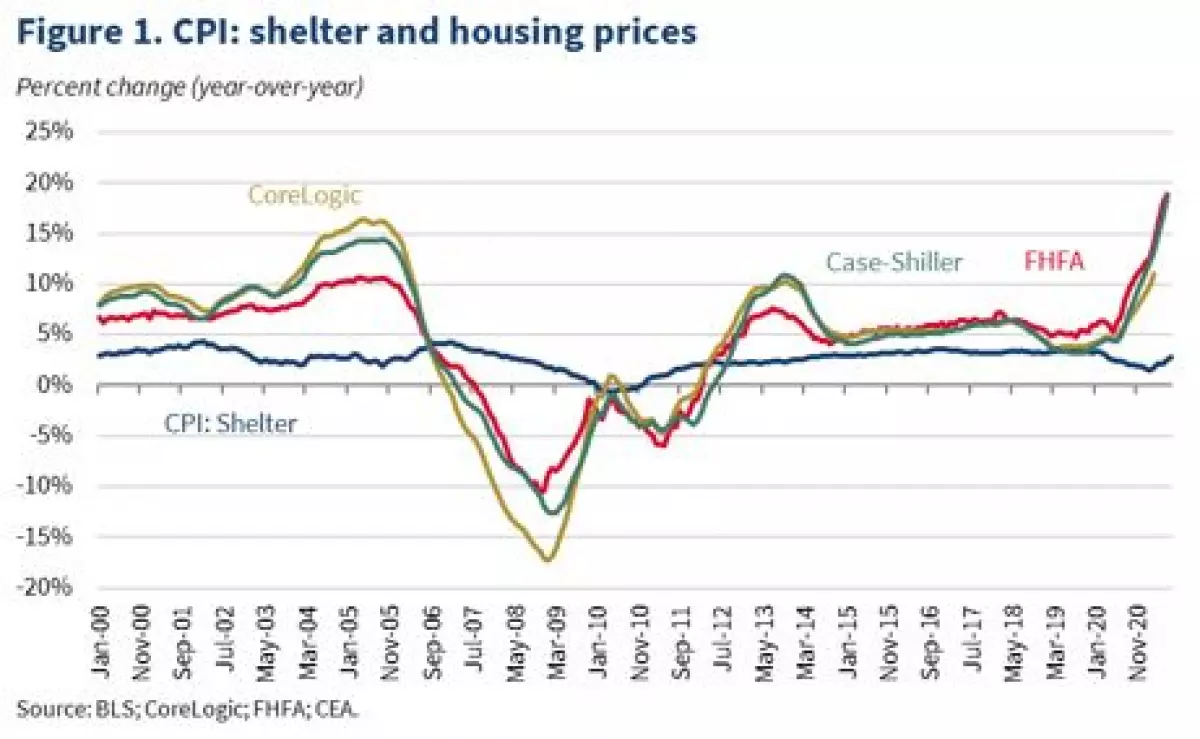
The current pandemic has brought about an unprecedented surge in housing prices. Disruptions in the market, coupled with increased demand, rising building costs, and long-term supply constraints, have contributed to soaring home values. In fact, the Case-Shiller U.S. National Home Price index has experienced a remarkable 18.6 percent growth over the last year, the highest ever recorded. Other indices also demonstrate similar upward trends.
While rental prices initially dipped during the pandemic, they have since rebounded and now surpass their pre-pandemic levels. However, these surges in owned home and rental costs have yet to significantly impact overall inflation, primarily due to the way shelter costs are factored into the Consumer Price Index (CPI). But our analysis suggests that these escalating shelter prices will soon have a more noticeable impact on monthly CPI inflation, potentially adding several basis points to the current rate. It is important to note that this acceleration simply signifies a return to the pre-pandemic norm for shelter contributions to inflation. Additionally, these housing price dynamics are already factored into inflation forecasts, which indicate a decrease in overall price growth in the coming quarters.
The pandemic has undoubtedly introduced higher-than-normal volatility and uncertainty into economic data. Therefore, while we acknowledge the historical relationship between housing prices and CPI inflation, we also consider that these unparalleled economic times may challenge the validity of such correlations.
Factors Contributing to Rising Home Prices
The interplay between demand growth and supply constraints significantly impacts housing prices. Long-term issues, such as local zoning restrictions and limited affordable or public housing, have persistently influenced housing supply in the United States. The pandemic has further exacerbated supply concerns by driving up the prices of crucial commodities and increasing the cost of home construction. For instance, lumber prices have skyrocketed by 114 percent over the past 12 months, reaching unparalleled highs. Similarly, iron and steel prices have surged by 73 percent between June of the previous year and June of the current year. However, recent data indicates a slight decline in lumber prices, hinting at a potential easing of price pressures.
In addition to supply factors, the pandemic has also triggered demand-related dynamics resulting from remote work and increased mobility. With the onset of the pandemic, there was a notable migration away from city centers towards suburbs and less densely populated areas. This shift in living preferences led to heightened churn in the housing market. Moreover, historically low mortgage rates have made borrowing more affordable, further fueling the demand for new homes.
As a result, the gap between supply and demand has widened. The seasonally-adjusted inventory of homes, according to Redfin, has seen a decline of over 50 percent since February 2020. Similarly, the Census Bureau estimates a 37 percent decrease in the inventory of for-sale homes since the fourth quarter of 2019.
Understanding the Relationship Between Housing Prices and CPI Inflation
Rising home prices have direct repercussions on household wealth and neighborhood affordability. Furthermore, they play a vital role in overall inflation. The Consumer Price Index (CPI) measures the prices of various goods and services that households regularly consume. It includes a shelter component, encompassing both rental costs and the consumption value of owner-occupied housing, in addition to other lodging forms like hotels. Shelter comprises nearly a third of the CPI inflation basket and 40 percent of the core CPI basket, which excludes the volatile food and energy components. Therefore, even slight increases in rent and home prices can have noticeable effects on overall inflation.
However, comprehending the impact of housing on inflation necessitates understanding the purpose of inflation data itself. The CPI serves as a cost-of-living index, designed to gauge the prices of goods and services consumed by households. It does not aim to measure the value of investment assets like stocks. This poses a unique challenge when incorporating owner-occupied housing in CPI calculations. Housing prices reflect both the investment asset value and the service value of housing. Prior to 1983, CPI: Shelter was calculated using a methodology that considered housing prices, mortgage rates, property taxes and insurance, and maintenance costs. This approach accounted for both the consumption of housing services and the asset investment aspect of housing expenditures. Consequently, during this period, house prices closely tracked CPI: Shelter. Interestingly, a 1 percentage point increase in year-over-year growth in housing price indices predicted a 76 basis point increase in year-over-year growth of CPI: Shelter in the following year.
Nevertheless, in 1983, the Bureau of Labor Statistics (BLS) deemed the investment component inconsistent with the role of CPI as a cost-of-living index. Consequently, the methodology transitioned to the "rental equivalent" approach. This method captures only the implicit value of services homeowners derive from their homes, excluding the asset value of houses as investments. It calculates owners' equivalent rent (OER) of primary residences by using a subset of rental data, weighted by homeowners' perception of the monthly rental value of their homes (excluding furnishings and utilities). This approach aims to more accurately measure the price of services homeowners receive from their homes, distinct from the value of homes as investments.
Due to these methodology changes, the relationship between housing prices and CPI: Shelter weakened in the mid- to late-1980s. The shift to the "rental equivalent" approach curtailed the growth in CPI: Shelter and reduced its volatility. Ever since the early 1980s, the connection between housing prices and CPI has diminished. From 1985 to 1999, a 1 percentage point acceleration in year-on-year growth in housing indices correlated with a 15 basis point rise in CPI: Shelter after 22 months. Since 2000, the correlation has changed to 11 basis points after 16 months. Similar trends emerge when examining CPI: OER, with a predictive effect of 15 basis points after 23 months pre-2000, and 9 basis points after 16 months post-2000. Since the end of the Great Recession, the impact of housing prices on CPI: Shelter has remained consistent at around 11 basis points.
Recent Behavior and Expectations
Historical analysis demonstrates a connection between housing prices and CPI, albeit with a lag and a non-linear relationship. Despite the pandemic-induced lows, both CPI: Rent and CPI: OER have experienced growth acceleration, as depicted in Figures 7 and 8. While owners' equivalent rent has returned to pre-pandemic growth levels, CPI: Rent remains below its previous pace. Notably, CPI: Rent, which encompasses both on-the-market and occupied rentals, exhibits less volatility than on-the-market asking rent measures like the Zillow index.
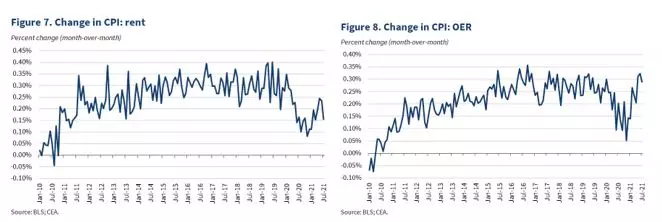 Image: A visual representation of recent trends in CPI: Rent and CPI: OER.
In the months ahead, there is a possibility of additional acceleration in the housing components of CPI due to recent home price appreciation. Furthermore, as shown in Figure 9, rental and housing prices in CPI currently fall below their pre-pandemic trends. A return to these trends would require a temporary acceleration in growth rates. Illustratively, if CPI: Rent and CPI: OER were to return to trend levels by July 2022, that would entail around 13 basis points added to core CPI inflation each month. This figure represents approximately 2 basis points more than the pre-pandemic contribution and 1 basis point more than what was observed in June 2021. To provide context, in June, vehicle-related components of CPI contributed over 50 basis points to monthly core CPI inflation.
Nevertheless, it is important to remember that the pandemic has disrupted traditional economic dynamics, rendering past relationships uncertain. As input prices stabilize and pandemic-induced demand dynamics fade, any pressure from housing inflation is expected to diminish. However, there is a possibility that some pandemic-era supply and demand factors may endure longer than anticipated. Even as these factors recede, the pre-existing structural issues in housing supply will persist. Thus, only time will reveal the true magnitude of the spillover effect on inflation. The Council of Economic Advisers (CEA) will continue to closely monitor price evolution and its various drivers in the months ahead.
[1] Weights for PCE inflation are calculated from NIPA Table 2.4.5U and represent the nominal consumption shares as a percentage of the total. Although the Personal Consumption Expenditure price index (the metric closely monitored by the Federal Reserve) incorporates CPI: Rent and CPI: OER, housing constitutes a smaller share of PCE inflation due to its broader scope and different weighting methodology. On average, housing accounts for 16 percent of headline PCE and 18 percent of core PCE.
[2] To assess the relationship between housing prices and CPI: Shelter, we conducted bivariate regressions of year-on-year CPI: Shelter or CPI: OER inflation on lagged Case-Shiller growth. We optimized the number of lag months for each sample period by selecting the coefficient that resulted in the highest r-squared value. Serially correlated errors were controlled using the Prais-Winsten procedure.
[3] Similar results were obtained using three-month growth rates instead of twelve-month rates.


